Study Set:
+25 Math Questions for SAT Prep - Group 1
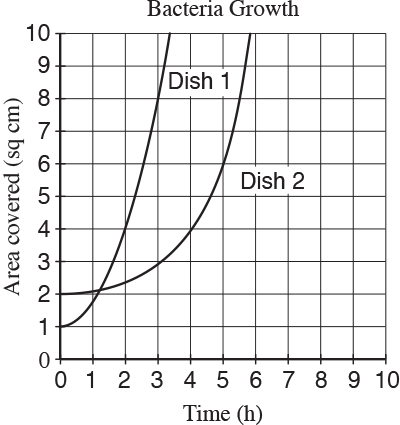
A researcher places two colonies of bacteria into two petri dishes that each have area 10 square centimeters. After the initial placement of the bacteria left parenthesis t space equals space 0 right parenthesis comma the researcher measures and records the area covered by the bacteria in each dish every ten minutes. The data for each dish were fit by a smooth curve, as shown above, where each curve represents the area of a dish covered by bacteria as a function of time, in hours. Which of the following is a correct statement about the data above?

Select the Correct Answer:
At time t = 0 ,both dishes are 100% covered by bacteria.
At time t = 0 ,bacteria covers 10% of Dish 1 and 20% of Dish 2.
At time t =0 ,Dish 2 is covered with 50% more bacteria than Dish 1.
For the first hour, the area covered in Dish 2 is increasing at a higher average rate than the area covered in Dish 1.
