Study Set:
+25 Math Questions for SAT Prep - Group 1
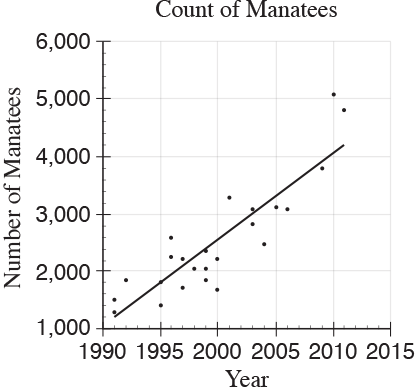
The scatterplot above shows counts of Florida manatees, a type of sea mammal, from 1991 to 2011. Based on the line of best fit to the data shown, which of the following values is closest to the average yearly increase in the number of manatees?
Select the Correct Answer:
0.75
75
150
750