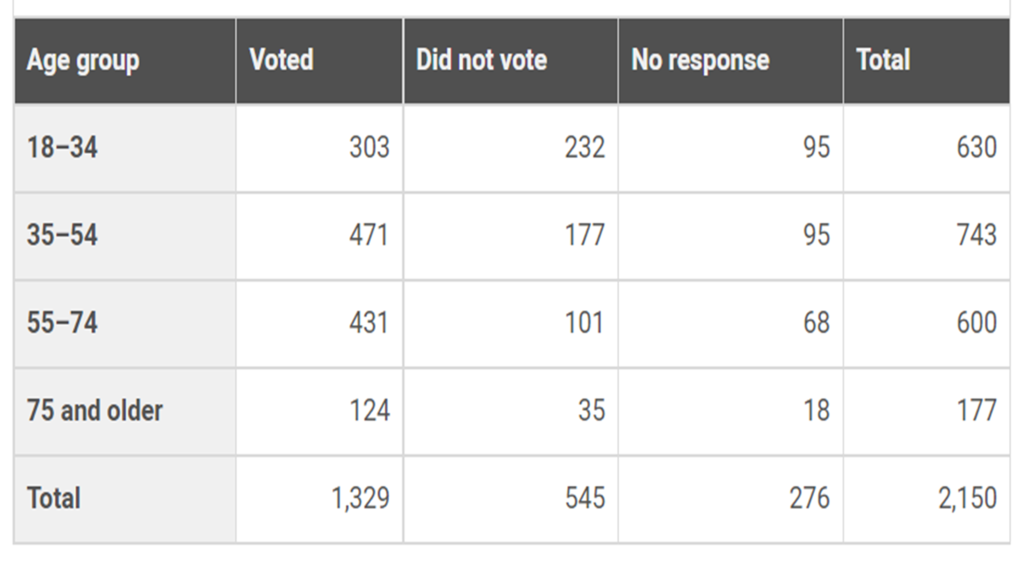
A survey about voter participation in the 2012 US presidential election was conducted among a randomly chosen sample of US citizens. The table summarizes the results by age group.
According to the table, which age group has the greatest percentage of people who reported voting in the 2012 presidential election?
55–74
The question asks you to select the relevant information from the table to compute the percentage of voters for each age group in the table and then compare the percentages to identify the largest one, which is the percentage for the age group in choice C. Of the 600 total people in the 55–74 age group, 431 reported that they had voted, which represents 71.8% of the people in the 55–74 age group. This is the greatest percentage of reported voters from among the four age groups.