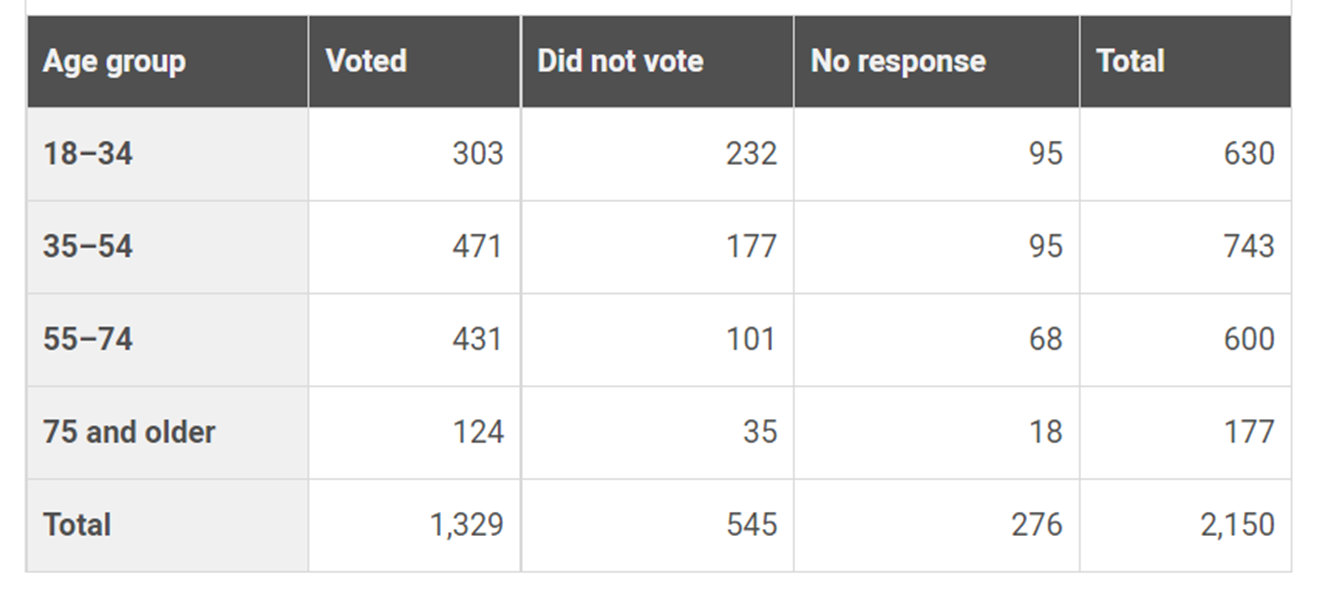
A survey about voter participation in the 2012 US presidential election was conducted among a randomly chosen sample of US citizens. The table summarizes the results by age group.
A second sample of 50 people from the 18–34 age group who reported voting in the 2012 presidential election were selected at random and asked which candidate they voted for. Of these people, 29 responded that they voted for Candidate A, and 21 responded that they voted for someone else. Based on this information, which of the following is the most appropriate estimate of the number of people from the 18–34 age group in the survey who voted for Candidate A in the 2012 presidential election?
176
Choice D is the correct answer. This question asks students to extrapolate from a random sample to estimate the number of survey participants from the 18–34 age group who voted for Candidate A. This is done by multiplying the fraction of people in the random sample who voted for Candidate A by the total number of people in the survey in the 18–34 age group: 29⁄50 × 303 ≈ 176 people.